ETC measures room decay time graphically, by showing the decay of a pulse over time. Typically, you will make an impulse sound by clapping your hands, popping a balloon, or even snapping your fingers. The graph will show the decay of this signal over time, and from this, the RT60 time can be computed.
See our new demo video of this module.

Available in AudioTools on the App Store
How to use ETC
Here is the Energy Time Curve main screen:
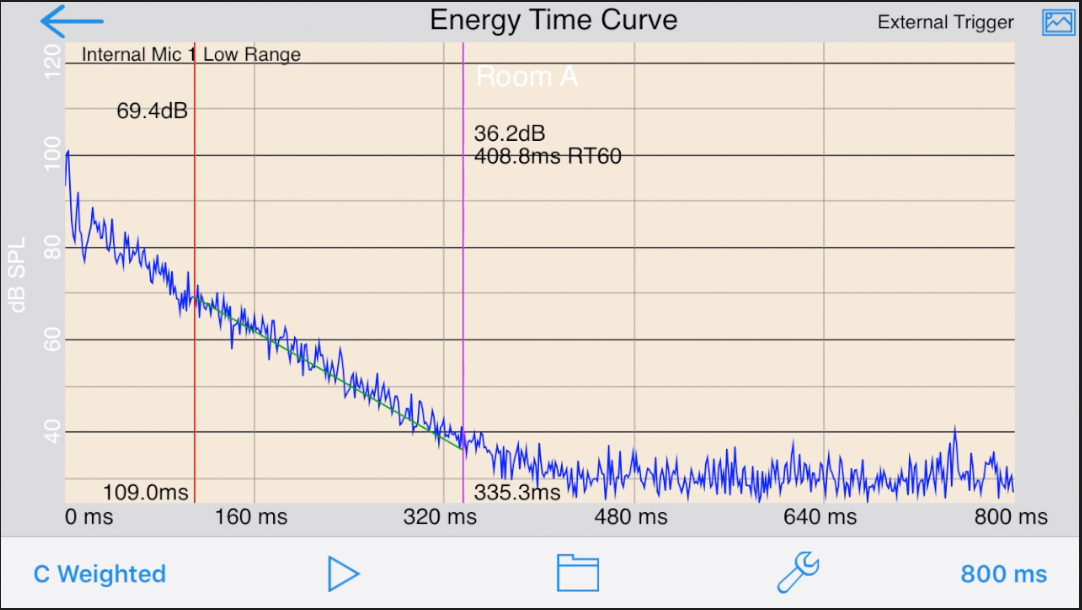
This shows a typical ETC measurement, made by simply snapping fingers in a small office, using External Trigger mode (see below). You can see the initial peak sound, and then the decay of the sound over time. A-Weighting was used to remove low frequencies (and very high ones) from the test. We used a 400ms time window to capture the full decay of the impulse.
After the test, we used a two-finger swipe gesture to move the red and purple cursors to roughly the start and end of the linear portion of the decay curve, and the app calculated the equivalent RT60 time of the decay (shown on the purple cursor, and with the green decay line).
Detailed information is below on setup and all of the options available.
Setup Screen
Here is the ETC setup screen:
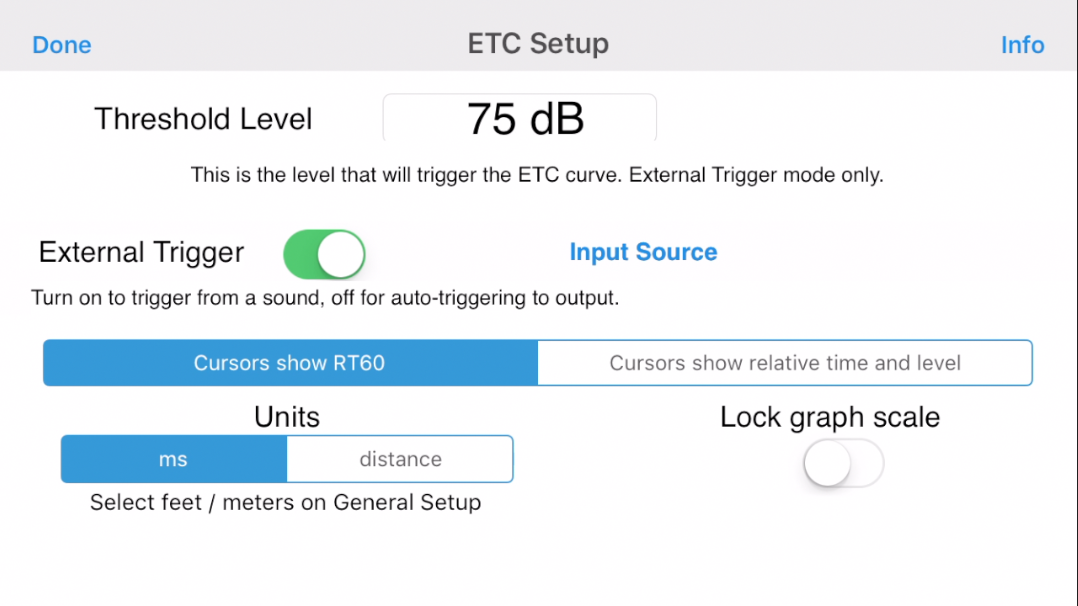
External Trigger
If you will be making the impulse sound to trigger the graph, select External Trigger. In External Trigger mode, you can calculate RT60 times, but not absolute delay times.
Turn External Trigger off if you want to use the internal impulse signal from the iOS device. In this mode, you have to route the audio output of the iPhone to your sound system input. ETC will start the graph from the exact time that the pulse is sent from the iPhone. You can then see the time that it takes for the pulse to reach the iPhone from the speaker. Use this to set speaker delay times.
Threshold Level
The Threshold Level is used to set the audio level at which the graph will trigger in External Mode. It has no effect in Internal mode. Set this value high enough above the ambient noise level (which can be seen for example, on the SPL Meter) to prevent inadvertent triggering, but low enough to allow the graph to be triggered when your impulse occurs.
Units
You can select ms (milliseconds), or a unit of distance: feet or meters. If a unit of distance is selected, then the time in ms is converted to distance using the speed of sound. In most cases, you will want to use ms, but if you are interested in distance, for example in measuring speaker delay in Internal mode, you may want to use distance.
Main Screen
On the main screen, you have one button to select the weighting, another to select the time window, and one more that lets you save a snapshot of the screen to your photo roll. There are also cursors that can be used for reading out exact dB, time, and RT60 times. And, the screen resolution and scale can be adjusted using gestures.
There are also buttons for saving and recalling graphs, entering the setup screen, and starting and stopping the test.
Weighting
Touch this button to cause a picker to appear with the weighting choices. You can select ANSI A-weighting (think:voice), C-weighting (think:music), and any of 10 octave band weightings, which isolates that octave, or no weighting. For general use, we suggest using A-weighting to filter out rumble that would otherwise raise the ambient noise level and reduce the available decay range.
Time Window
Touch this button to select the time window for the graph. Use shorter windows for smaller rooms, and larger windows for larger, more reverberant rooms. After you have seen the decay curve, if it doesn’t decay all the way around, select a longer time. If it decays in a small part of the screen, select a shorter time window.
Note that if you have selected a distance unit on the flip side screen, this field will still be shown in ms, although all areas on the screen will be converted to the equivalent distance, using the speed of sound.
Cursors
If you slide one finger horizontally across the screen, a cursor will appear that shows the exact dB level and time or distance for the point that intersects the cursor.
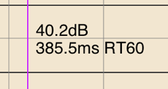
If you use two fingers, you get a second cursor. By placing the two cursors at the start and end of the decay curve, the equivalent linear RT60 time is computed and displayed on the second (right-hand) cursor. To get the most accurate reading, make the green decay line as parallel as possible to the actual decay.
Graph Scaling and Resolution
You can use your finger to slide the screen up and down, to properly fit the graph on the screen.
You can also use a vertical pinch gesture to compress or expand the dB range of the graph, to see more detail, or to fit a graph on the screen.
Double-tap the screen to normalize it to fit the curve currently present.
Saving and Recall Graphs
AudioTools has a very advanced and complete save/recall system. See the Save / Recall page for full details.
Capturing Images
To capture an image of the graph on the screen, including any cursors that are showing, touch the “Save Image” button. The current graph will be stored in a file in your photo roll