AudioTools provides many options for measuring and analyzing sound. A number of these include SPL dB values, and although they may all be displayed as a single numeric value, they may mean different things, or have different values. We will try to explain these differences here.
Overall SPL dB
The most common measure is a simple overall, or wide-band, SPL dB value. This appears in many locations:
- -SPL Meter
- -SPL Pro
- -SPL Traffic Light
- -RTA graph, upper right corner
- -FFT graph, upper right corner
- -Smaart Tools, upper left corner
- -Microphone Calibration, dB field
This value is dynamic representation of the overall sound level in the room. It will vary as the sound in the room is louder or softer — unless, that is, you are in Leq mode. Leq simply means an SPL average over time. So an Leq10 will typically be the average SPL level over 10 minutes. This mode is available in SPL Pro, SPL Graph, and SPL Traffic Light.
The overall SPL level usually has a weighting applied to it. A weighting is simply a filter, or set of filters, that alter the effect of certain frequencies on the reading. Common weightings are A and C. Note in the graph below that A weighting removes a lot of energy in the low frequencies, as well as attenuating high frequencies, while C removes much less of the lows, and still some highs.
Some people think of A-weighting as “voice” and C-weighting as “music”.
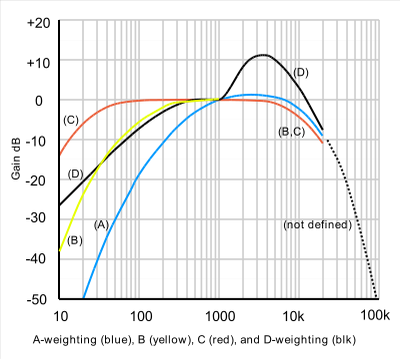
Given the difference between A-weighting and no weighting, if the ambient sound in the room has a lot of low frequencies (which are less audible, see curve below), then the difference between a A-weighted SPL reading and an unweighted SPL reading could be 30-40 dB or more.
Here’s how this works in AudioTools. Say you open SPL Meter, which has only A and C weighting, and leave it set to A. The reading might be 35dB, in a typical quiet room. Now switch to RTA (which has choices for overall weighting, A, C, or none) or FFT (which only supports choices for weighting on some platforms and otherwise is “none”), and you might see 55dB.
Which number is right? Both, of course, but they will not match unless the same weighting is selected for both measures.
Octave or Fractional Octave Band dB
Now we will look at how breaking up the audio spectrum into bands effects the dB levels that are displayed.
Say we have pink noise (which is wide-band noise filtered so that each octave or fractional octave band has the same energy, the same way that the ear hears it) at 80dB. What will the RTA show for the level of each octave band?
The answer is not 80 dB. A good way to visualize this is to remember that 80 dB really refers to an amount of acoustic energy. If we break up the audio spectrum into 10 bands, each band would hold 1/10 the energy of the total. But to add them, since we are working in dB, it is not a linear formula — otherwise each band would be 8 dB!
The formula for the increase in summing equal loudness sources is
dB = 10 * log10( n ) dB to add for n sources
Where n is the number of sources. For n = 10, the answer is 10. So, if the overall level was 80 dB, each octave band would be 70 dB.
If you switch to 1/3 octave, the amount to add is 14.7 dB, so each band would be 65.3 dB.
What about sine waves? In this case, if we have a sine wave at 75 dB at 1000Hz, the 1000Hz octave or 1/3 octave band will read 75 dB, and the overall will show something slightly higher than 75 dB, since it adds the single band energy (75) with the other bands, again using a log10 formula.
For some great online dB calculators and general acoustics information, check out this acoustics site.
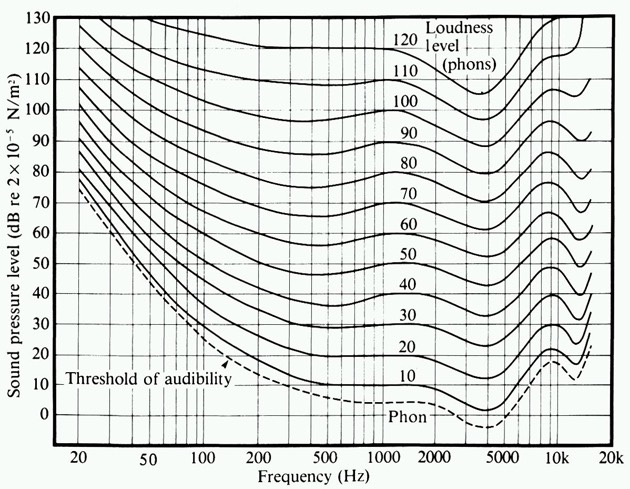
Equal Loudness Curves and Threshold of Hearing
Here is graph that shows how the human ear perceives loudness, by frequency and SPL level. The thing that is really obvious is at quiet levels, we don’t really hear low frequencies. In fact, we can’t even hear 60Hz until it’s above 40dB, and we can’t hear 20Hz until it reaches over 70dB!
So this is why an unweighted SPL reading might show 50 or 60 dB, in what we consider a very quiet room. The RTA or FFT will show the actual sound levels, and so become very useful tools for understanding the entire sound spectrum in a room.