RTA is a full-featured filter-based one-third octave Real Time Analyzer. It includes a built-in pink noise generator, options for octave and 1/3 octave display, peak hold and decay, and many other options. Save and recall tests, and export them to your computer. Overlay useful plots, to show theater X-curve, or noise curves like NCB, NC, or NR.
You can also see the flat, A, or C weighted SPL, max & min bars, peak decay bars, or even a threshold of hearing line.
✨ Master your setup: Follow our new Sound System Setup Guide for a quick, pro-quality result.

Available in AudioTools on the App Store
Don’t know if you should download FFT or RTA? Check out our comparison page for more information.
The Transmission Loss module has been moved out of RTA, and is now on the main Acoustic Analysis menu, and now includes room reverb time analysis, ambient noise correction, and compliance with many domestinc and international standards.
RTA uses filters (rather than an FFT) conforming to ANSI and IEC specifications. It can be calibrated, and uses either the built-in mic, the headset mic, or the Studio Six Digital iTestMic or iAudioInterface2.
Includes support for the optional Reference Curves feature.
*** NEW: Check out our new demo video of RTA.
See our “dB vs. dB” page to understand what the SPL numbers mean, and why they might be different on different modules.
Bluetooth and Airplay Output
See our information about using Bluetooth or Airplay.
How to Use RTA
Here is the RTA main setup screen:
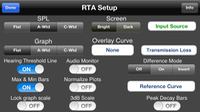
Band Size
To use RTA, select the band size that you want, either Octave or 1/3 Octave.
Decay Modes and Speed
Select the decay mode and speed. You can select one of the exponential decay modes, which are labelled in seconds. The seconds indicate the amount of time for a bar to decay by 20dB.
Also, you can select Peak Hold, which holds the highest value that a bar has reached. To reset Peak Hold, re-select Peak Hold mode.
There is one more mode, Average. This mode performs a continuous equal-weighted average, from the time you start the RTA with the Play button in this mode, until you Pause the RTA. Even then, you can continue the average by pressing Play. To reset Average mode, tap the Reset button on the screen.
Play / Pause
Touch the Play/Pause icon to begin. Anytime one of the parameters is changed, the RTA will revert to Pause so that the new parameters can be in effect for the most accurate readings.
Screen Scaling & Resolution
Once the graph is running, you can adjust the screen dB scale by sliding the graph and up and down. You can also change the dB resolution showing on the screen by pinching — pinch together to get more dB on the screen, or pinch apart to get less vertical dB, and thus more detailed resolution. Double-tap the screen to auto-fit the graph to the display.
You can turn on Lock Graph Scale if you want to set a graph range and not have it change on the main screen. The level may still be panned up and down, but the range will not change and the double-tap will not change the scale or range.
Saving a Screen Image
You can take a snapshot of the screen by touching the Save Image button. The image will be saved in your photo roll, and can be emailed or transferred to your computer using various third party apps.
Noise Curve Overlays
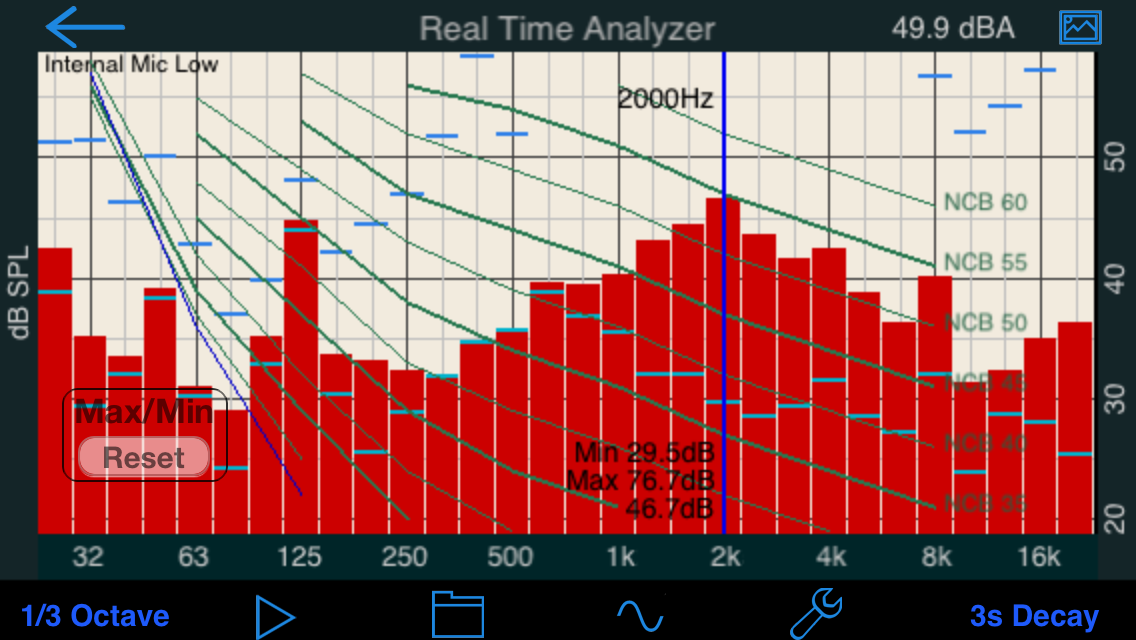
To display a noise curve overlay, flip the screen over by touching the info icon in the navigation bar, and select one of the overlays: NCB — Balanced Noise Curve, RC — Room Curve, PNC, NR, or Noise Rating, used in the EU, and the cinema large-room X-curve.
The overlay will appear on the graph. To read the noise curve value, find the lowest curve that does not have any bars touching it. You can interpolate between curves to estimate an exact curve number.
Starting in RTA in AudioTools 4.0, now see the overall noise overlay curve value — in octave mode only, since the noise curve values are only defined for octave band mode.
Graph Weighting
You can select none, A, or C weighting. None will show the actual level of each bar. If you select a weighting, the bars will show the weighted equivalent. This means that the lower frequencies will show lower values in A or C weighting.
Max / Min Bars
You can turn on this option on the setup page. When active, the maximum and minimum levels of each bar is stored, and shown as blue and green bars on the screen.
To reset the bars, just double-tap the screen.
Peak Decay Bars
Peak decay bars will show you the actual peak level of the band, no matter what decay mode you have selected. They automatically decay and will drop into the graph when there is no level above the bar.
Hearing Threshold Line
This line shows the approximate level below which sounds are inaudible to the human ear. This varies somewhat by person, but even so it can be used as a guide to when sounds are not audible.
Overall SPL
The overall unweighted dB SPL level is shown just above the graph, on the right side. Choose unweighted SPL, or A or C weighting on the setup screen.
Audio Monitor
Turn this on to listen to the incoming audio signal in the output. Note that this may cause feedback. Turning on the generator disables Audio Monitor.
Pink Noise
RTA includes a full-featured signal generator, which includes sine waves, square waves, white noise, and pink noise. Pink noise has equal energy in each octave (or 1/3 octave), so in theory if your system is flat, you will see a flat line on the RTA display.
Room Tuning
In practice, the RTA is really showing the sum of the direct sound as well as the reflections, so this is not 100% correct. Also, most people roll off the high end somewhat, and many like to boost the low end. So, use the RTA and it’s information, but also use common sense, and don’t make extreme EQ changes. You’re usually better off making conservative changes in EQ, but you should definitely try moving speakers and subs around, and watch the effect in the RTA.